Serving a Computer-Use Agent on a 16 GB GPU with vLLM
I replayed a 10-step computer-use task with Holo 3.1 on a 16 GB GPU. Prefix caching cut the run time by 30%, and running 8 agents at once produced fewer tokens per second than running 4.
Table of Contents
I recorded a 10-step search for the British Library’s opening hours so I could give a computer-use model the same task on every run. At each step, I sent the model a new screenshot, along with all previous screenshots and my actions so far. By the last step, the prompt was 10,350 tokens long, and the model already saw 9 of the 10 screenshots.
How much faster is the run when the server can reuse that history? I used vLLM to serve Holo 3.1 4B , an open-weights model for computer use, on my 16 GB RTX 5070 Ti. I replayed the same 10 steps with prefix caching on and off. In both cases, the model generated exactly 64 tokens per step.
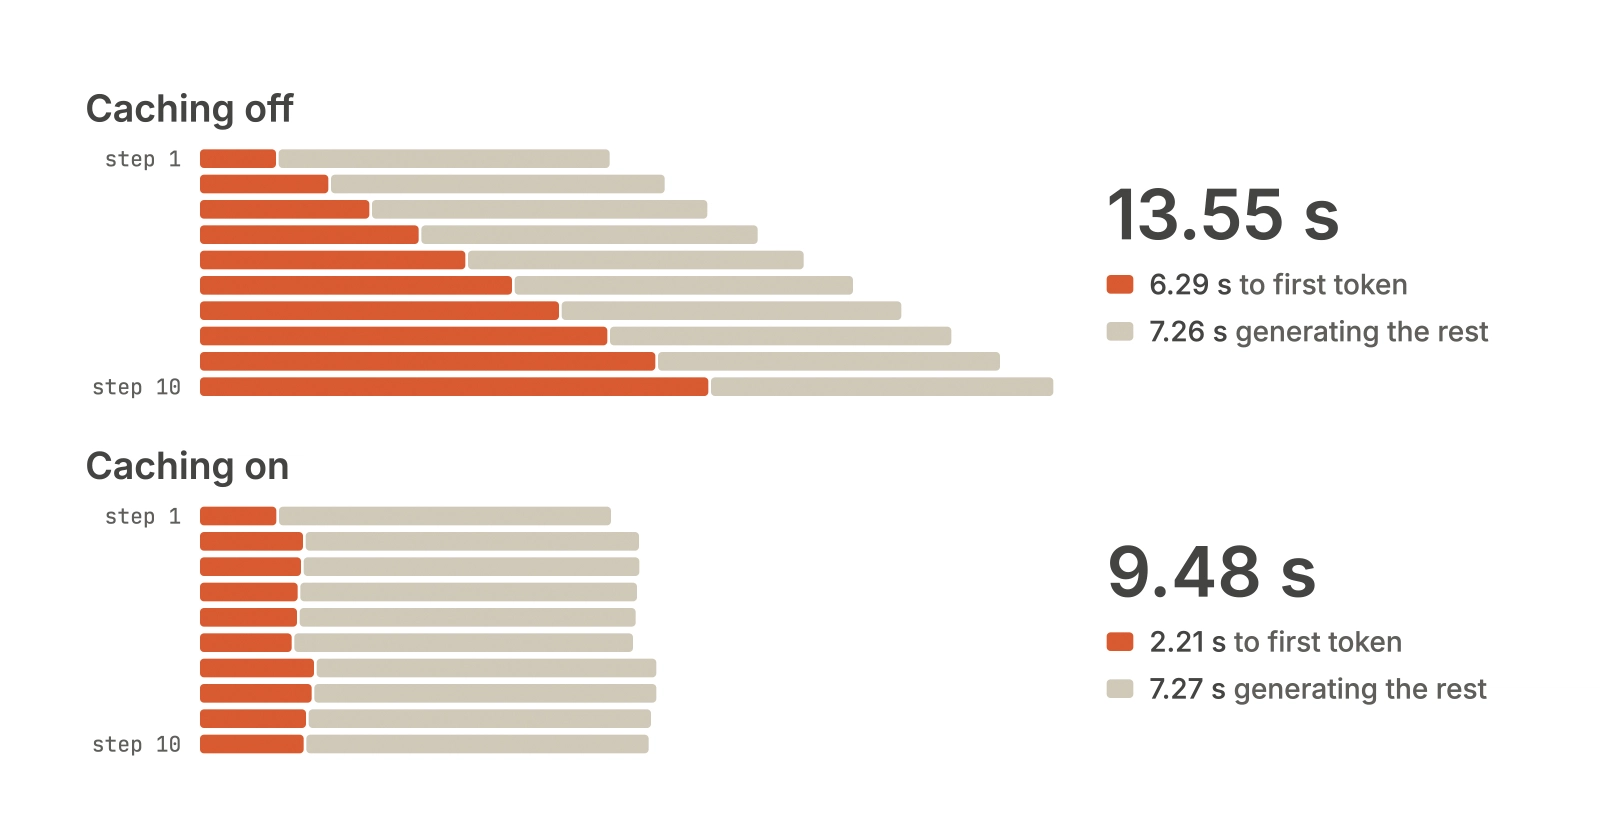
With prefix caching on, the server avoids processing most of the same history again. This cut the total run time by 30%, from 13.55 s to 9.48 s. The speedup came from getting to the first token sooner. Generating the rest of the answers took about 7.3 s in total either way.
When I ran 4 agents at once, they generated 166 tokens per second in total, about 2.5 times the rate of a single agent. With 8 agents, the combined rate fell to 90 tokens per second. Requests started to queue, and vLLM had to process some of the history again.
Before running the replay, I wrote down 4 predictions. I got only 1 right. Most of this post is about why I got the other 3 wrong.
The scripts, screenshots, raw results and server logs are in the rd-blog repository .
The setup
The machine is a desktop running Ubuntu 26.04 with an RTX 5070 Ti (16 GB, 896 GB/s memory bandwidth), NVIDIA driver 610.43, Python 3.14, PyTorch 2.14 with CUDA 13.0 and vLLM 0.33.0.
Holo 3.1 4B, from H Company, is a vision-language model for computer use. It reads a screenshot and decides what to do next. The other sizes in the Holo 3.1 release are 0.8B, 9B and 35B-A3B. In BF16, the 9B model needs about 18 GB just for its weights. So 4B is the largest version that fits on my card with room left for the KV cache.
Its architecture is Qwen3.5 (Qwen3_5ForConditionalGeneration), which mixes 2 kinds of layers. The config.json shows that 24 of the 32 layers use linear attention, and only every 4th layer uses full attention:
"layer_types": ["linear_attention", "linear_attention", "linear_attention",
                "full_attention", ...]
"full_attention_interval": 4
A full-attention layer stores keys and values for every token it has seen. A linear-attention layer keeps one fixed-size state per request instead. So the KV cache grows with the history in 8 layers, not 32. This matters later for the KV cache size per token in Decode speed and for the 576-token blocks in Prefix caching across 10 steps .
In the browser task, I looked up the British Library’s opening hours for the building, the Reading Rooms and the Treasures Gallery. It took 10 steps, from a Google search through the site’s Visit page and menu to expanding each part of the opening hours section. I took a screenshot after each step and resized each one to 1280 × 803.
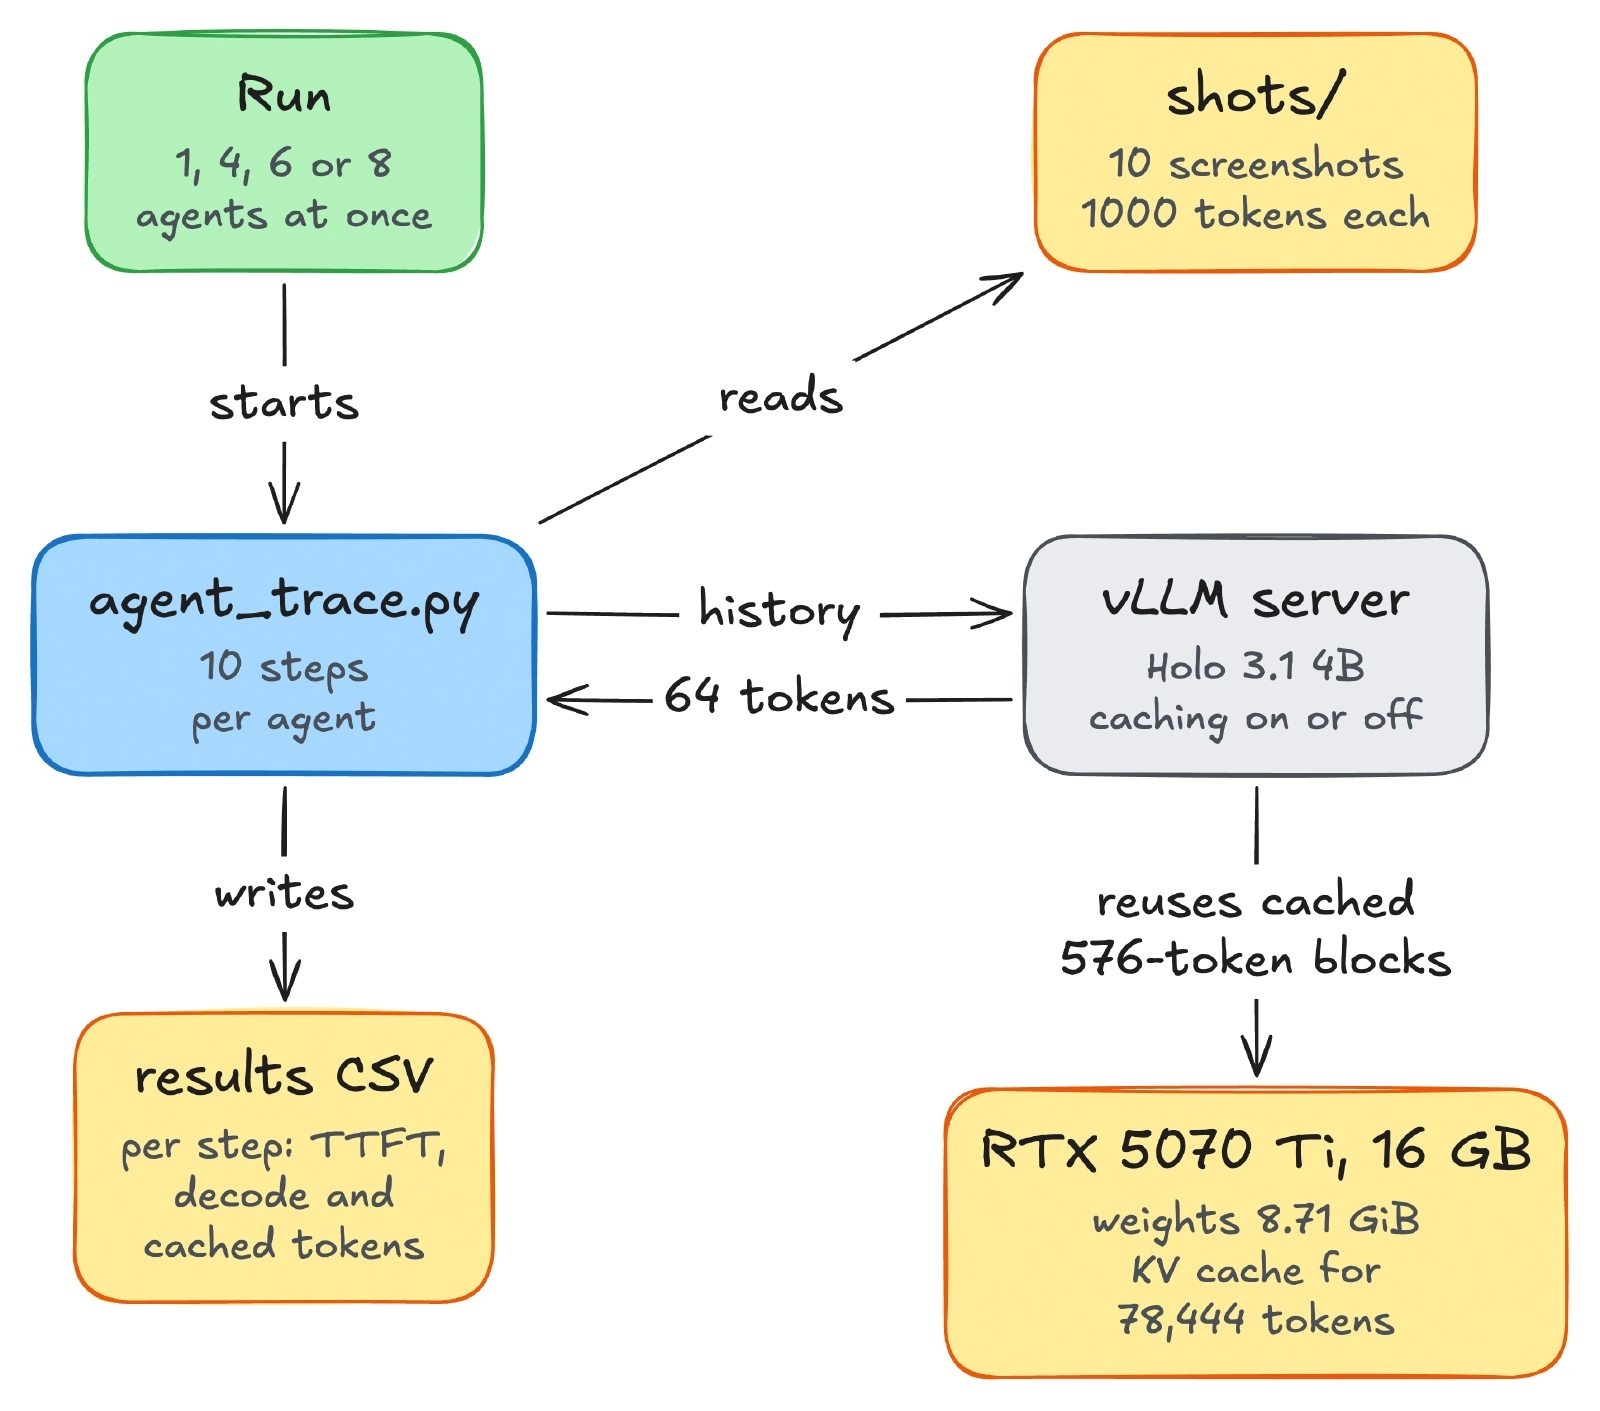
The replay script, agent_trace.py, sends 10 requests, one per step. Request k includes the system prompt, the task, screenshots 1 to k, and the action taken after each earlier screenshot. A few choices keep the numbers comparable:
The history is append-only. Every request starts with the full token sequence from the previous one, which is what prefix caching needs.
The actions are fixed strings recording what I did, such as
{"action": "click", "target": "Visit"}, so every run sends the same history.Every answer is exactly 64 tokens, so only the prompt changes from step to step.
max_tokens=64stops the answer at 64 tokens. A model can also stop earlier by generating its end-of-sequence token, andignore_eostells vLLM to keep going past it, so the answer never ends before 64.Every run starts its system prompt with a random run ID and changes 1 pixel in each screenshot. The run ID keeps a run from reusing another run’s prompt history, and the changed pixel keeps it from reusing another run’s processed images. The image cache explains why the pixel change matters.
A warm-up request with a blank image runs first. vLLM compiles most of its GPU code (kernels) at startup, but with caching on, 1 kernel was still compiled during the first request:
Triton kernel JIT compilation during inference: store_cache_checkpoints_kernel.
  This causes a latency spike; consider extending warmup to cover
  this shape/config.
The warm-up request takes that cost instead of step 1.
The script streams each response and records the time to first token (TTFT), the decode time per token for the rest of the response, and the token counts vLLM reports. The setup has three parts: a replay script, a vLLM server and one GPU:
Getting the server to start
This is the command that worked:
vllm serve Hcompany/Holo-3.1-4B \
  --dtype bfloat16 \
  --max-model-len 32768 \
  --max-num-seqs 16 \
  --gpu-memory-utilization 0.85 \
  --limit-mm-per-prompt '{"image": 10}' \
  --enable-prompt-tokens-details \
  --enable-prefix-caching
Here’s what the options do:
--dtype bfloat16keeps the weights in BF16, at 2 bytes per parameter, the same format as the model files on Hugging Face.--max-model-len 32768caps each request at 32,768 tokens, including both the prompt and the answer. Step 10 needs about 10,400.--max-num-seqs 16lets vLLM work on at most 16 requests at once. It also affects how many CUDA graphs vLLM records, which matters below.--gpu-memory-utilization 0.85lets vLLM use 85% of the GPU’s memory. What’s left after the weights and working memory goes to the KV cache.--limit-mm-per-prompt '{"image": 10}'allows up to 10 images per request, one per step.--enable-prompt-tokens-detailsmakes vLLM report how many prompt tokens it found in the cache. That’s where the “Cached tokens” numbers later in the post come from.--enable-prefix-cachingturns prefix caching on. The runs without it use--disable-prefix-cachinginstead.
It took 2 failures to get there. The first was a compile error while vLLM inspected the model:
triton/backends/nvidia/driver.c:9:10: fatal error: Python.h:
  No such file or directory
Triton
, the compiler vLLM uses for many of its GPU kernels, compiles a small C helper with gcc the first time it runs, and that needs Python’s headers. Ubuntu doesn’t install them by default, so sudo apt install python3-dev fixed it.
The second failure came at the very end of startup, while vLLM was capturing CUDA graphs. A CUDA graph records a sequence of GPU kernel launches so vLLM can replay them with a single call instead of launching each kernel separately:
memory allocation failed with OOM on device 0 while trying to allocate
  536870912 bytes (free: 198967296, total: 16648896512)
Capturing CUDA graphs (PIECEWISE):   0%|          | 0/51
vLLM tried to allocate 536,870,912 bytes (512 MiB) with only 198,967,296 bytes (199 MB) free. Lowering --gpu-memory-utilization from 0.90 to 0.85 didn’t help. The same error came back with even less free memory:
memory allocation failed with OOM on device 0 while trying to allocate
  536870912 bytes (free: 197263360, total: 16648896512)
What helped was capturing fewer graphs. Each graph is recorded for a specific batch size. During decode, that’s the number of requests the GPU works on together. vLLM captures graphs for a list of batch sizes and pads smaller batches up to the nearest captured size. The startup log lists these sizes, which go up to 512 by default:
'cudagraph_capture_sizes': [1, 2, 4, 8, 16, 24, 32, ..., 480, 496, 512],
  'max_cudagraph_capture_size': 512
That’s 51 sizes, the 0/51 in the progress bar above. In this setup, vLLM sets the largest size to twice --max-num-seqs, capped at 512 (_set_cudagraph_sizes in
vLLM 0.33.0’s config
), so the default of 256 requests gives 512. With --max-num-seqs 16, the largest size became 32, and all 7 sizes fit in 0.06 GiB:
'cudagraph_capture_sizes': [1, 2, 4, 8, 16, 24, 32]
Graph capturing finished in 1 secs, took 0.06 GiB
Once it started, one log line showed where all the GPU memory went:
Free memory on device (14.71/15.51 GiB) on startup.
  Desired GPU memory utilization is (0.85, 13.18 GiB).
  Actual usage is 8.71 GiB for consumed memory (weights + non-torch),
  1.69 GiB for peak activation, and 0.06 GiB for CUDAGraph memory.
  ...
Current kv cache memory in use is 2.78 GiB.| Where the memory goes | GiB |
|---|---|
| Total on the card | 15.51 |
| Already used by the desktop | 0.80 |
| Weights and CUDA overhead | 8.71 |
| Peak working memory during a forward pass | 1.69 |
| CUDA graphs | 0.06 |
| KV cache | 2.78 |
vLLM allocated 2.78 GiB to the KV cache, and the next log line shows how many tokens that holds:
GPU KV cache size: 78,444 tokens,
  Maximum concurrency for 32,768 tokens per request: 2.39x
Predictions
I wrote these down before running the replay:
| Prediction | Value | From |
|---|---|---|
| Weights on the GPU | 9.64 GiB | 5,174,964,736 parameters × 2 bytes (BF16) |
| Tokens per screenshot | 1000 | 1 token per 32 × 32 pixel square, so (1280 ÷ 32) × (800 ÷ 32) = 40 × 25 |
| Fastest possible decode | 11.6 ms per token | Every weight read once per token: 10.35 GB ÷ 896 GB/s |
| 8 agents at step 10 | The server fails | 8 × 10,300 tokens of history, more than 78,444 |
The first 3 use only published numbers: the model’s parameter count and config, and the GPU’s spec sheet. The 4th uses one measured number: the 78,444-token KV cache from the startup log above. I wrote that prediction after the server had started.
Weight memory
The model files on disk come to exactly 9.64 GiB, but vLLM reported:
Model loading took 8.56 GiB memoryListing the tensors in the model files explained most of the 1.08 GiB gap. This script groups the tensors by the start of their names and adds up the parameters in each group, at 2 bytes per parameter:
import collections
import glob
import math
import os

from huggingface_hub import snapshot_download
from safetensors import safe_open

root = snapshot_download("Hcompany/Holo-3.1-4B", local_files_only=True)
sizes = collections.Counter()
for path in glob.glob(os.path.join(root, "*.safetensors")):
    with safe_open(path, "pt") as f:
        for name in f.keys():
            key = []
            for part in name.split("."):
                if part.isdigit():
                    break
                key.append(part)
            sizes[".".join(key[:3])] += math.prod(f.get_slice(name).get_shape())

for key, params in sizes.most_common():
    print(f"{params * 2 / 2**30:6.2f} GiB  {params:>13,}  {key}")
total = sum(sizes.values())
print(f"{total * 2 / 2**30:6.2f} GiB {total:>13,} total")It prints:
  6.65 GiB  3,570,049,536  model.language_model.layers
  1.18 GiB    635,699,200  lm_head.weight                     ← output layer
  1.18 GiB    635,699,200  model.language_model.embed_tokens  ← input embedding
  0.56 GiB    302,309,376  model.visual.blocks
  0.05 GiB     27,271,680  model.visual.merger
  0.00 GiB      2,359,296  model.visual.pos_embed
  0.00 GiB      1,573,888  model.visual.patch_embed
  0.00 GiB          2,560  model.language_model.norm
  9.64 GiB  5,174,964,736  total
The token embedding table (248,320 tokens × 2,560) is stored twice: once as the input embedding and once as the output layer. The config says tie_word_embeddings: true, so the model uses one table for both, and vLLM loads one copy. That gives 9.64 − 1.18 = 8.46 GiB, against the 8.56 GiB vLLM reported. I don’t know where the remaining 0.10 GiB comes from.
The same output explains the “4B” in the model’s name, although the files hold 5.17B parameters. With the embedding table counted once, the language model comes to 4.21B:
3,570,049,536  model.language_model.layers
  635,699,200  model.language_model.embed_tokens
        2,560  model.language_model.norm
4,205,751,296  language model, about 4.21B
The 4 model.visual lines are the vision encoder, which reads the screenshots. They add 333,514,240 parameters, about 0.33B. Together that’s 4.54B parameters, which at 2 bytes each is the 8.46 GiB above.
Tokens per screenshot
This one was exact:
prompt_tokens=1028 ... multimodal_tokens={'image': 1000}The vision encoder doesn’t read pixels one by one. It cuts the screenshot into squares of 16 × 16 pixels, called patches, and joins each 2 × 2 group of neighbouring patches into 1 token. So 1 token covers 32 × 32 pixels. Both numbers are in vision_config in the model’s config.json:
"patch_size": 16, "spatial_merge_size": 2The width and height have to be multiples of 32, so the 803-pixel height becomes 800. That gives (1280 ÷ 32) × (800 ÷ 32) = 40 × 25 = 1000 tokens. Each step adds about 1,030 tokens: 1000 for the screenshot and the rest for the action and the question. Step 10 came to 10,350 tokens.
Decode speed
Decode took 11.3 ms per token at step 1, faster than my 11.6 ms “fastest possible” estimate. The replay script measures the time from the first streamed token to the last, then divides by 63 to get the time per token. This is the first row of data/results-1-agents.csv:
label,step,prompt_tokens,cached_tokens,ttft_ms,decode_ms_per_token,step_ms
off,1,1066,0,168.2,11.31,880.7
Averaged over 3 runs, step 1 decodes at 11.31 ms per token with caching off and 11.34 ms with caching on.
The floor was too high because it counted bytes the GPU doesn’t read when generating a token:
- The second copy of the embedding table is never loaded. The weights take up 8.56 GiB (9.19 GB) on the GPU.
- The vision encoder only runs when processing screenshots. Text generation skips its 0.67 GB of weights.
That leaves 8.52 GB to read per token, so the estimated floor is 8.52 ÷ 896 = 9.51 ms. Reading 8.52 GB in the measured 11.3 ms gives about 754 GB/s, or 84% of the spec-sheet bandwidth. That ratio is called memory bandwidth utilisation (MBU), and it shows how close decode gets to the hardware limit.
Decode also slowed from 11.33 ms per token at step 1 to 11.69 ms at step 10. The GPU also reads the request’s KV cache for each generated token, and that cache grows with the history. For this model, the KV cache uses 2 (keys and values) × 8 full-attention layers × 4 KV heads × 256 × 2 bytes = 32,768 bytes per token. From step 1 to step 10, the history grows by 10,350 − 1,065 = 9,285 tokens. That means reading 9,285 × 32,768 = 304 MB more for each generated token. At 896 GB/s, those extra reads take 0.34 ms, close to the measured increase of 0.36 ms.
At this speed, generating the 64-token answer takes about 0.7 s per step, and caching doesn’t change it. That’s the grey part of every bar in Figure 1.
Prefix caching across 10 steps
The other part of each step is reading the prompt, and that’s the part prefix caching changes. I ran the replay 3 times with --enable-prefix-caching and 3 times with --disable-prefix-caching. For each setting, I averaged the results at each step. TTFT is the wait for the first token, most of which is spent reading the prompt. Step time covers the whole request, including the 64 generated tokens.
| Step | Prompt tokens | Cached tokens | TTFT, no caching | TTFT, caching | Step time, no caching | Step time, caching |
|---|---|---|---|---|---|---|
| 1 | 1,065 | 0 | 169 ms | 170 ms | 881 ms | 884 ms |
| 2 | 2,099 | 576 | 282 ms | 227 ms | 999 ms | 944 ms |
| 3 | 3,129 | 1,728 | 370 ms | 223 ms | 1,091 ms | 945 ms |
| 4 | 4,159 | 2,880 | 476 ms | 216 ms | 1,199 ms | 940 ms |
| 5 | 5,190 | 4,032 | 576 ms | 214 ms | 1,298 ms | 937 ms |
| 6 | 6,223 | 5,184 | 677 ms | 203 ms | 1,404 ms | 931 ms |
| 7 | 7,253 | 5,760 | 778 ms | 251 ms | 1,508 ms | 981 ms |
| 8 | 8,283 | 6,912 | 882 ms | 246 ms | 1,616 ms | 981 ms |
| 9 | 9,316 | 8,064 | 985 ms | 234 ms | 1,720 ms | 970 ms |
| 10 | 10,350 | 9,216 | 1,099 ms | 229 ms | 1,835 ms | 965 ms |
| All 10 | 13.55 s | 9.48 s |
The 3 runs for each setting agreed within 4 ms at step 10. Without caching, TTFT grows linearly at about 0.1 ms per prompt token, so the server reads about 10,000 prompt tokens per second. With caching, it stays between 203 and 251 ms from step 2 on. At step 10, caching cuts TTFT by 79% and total step time by 47%. Decode time is the same either way, because caching only changes how the prompt is read.
The “Cached tokens” column follows an exact rule, and it starts with this line from the server log:
Setting attention block size to 576 tokens
  to ensure that attention page size is >= mamba page size.
vLLM keeps the KV cache in fixed-size blocks, and prefix caching only reuses whole blocks. Its default block size is 16 tokens (DEFAULT_BLOCK_SIZE = 16 in
vLLM 0.33.0’s cache config
). For this model, it picked 576 instead. The “mamba page” in the log line is the memory used by the linear-attention layers, and vLLM made the attention blocks large enough to match it. I’ll cover how that works in another post. What matters here is that the cached token count at each step is the previous step’s prompt length rounded down to a multiple of 576:
| Step | Previous prompt | ÷ 576 | Whole blocks | Cached |
|---|---|---|---|---|
| 2 | 1,065 | 1.85 | 1 | 576 |
| 3 | 2,099 | 3.64 | 3 | 1,728 |
| 7 | 6,223 | 10.80 | 10 | 5,760 |
| 10 | 9,316 | 16.17 | 16 | 9,216 |
That explains the bump at step 7. The previous prompt filled 10 blocks, with 463 tokens left over, so the server read those again along with the new screenshot. That’s 1,493 uncached tokens, more than at any other step after step 2, giving step 7 the highest TTFT with caching on.
The image cache
My first runs were about 60 ms per step slower than the repeats. Here are the times to first token from those early runs, saved in data/results-image-cache-warm.csv:
| Caching | Run | Step 1 | Step 2 | Step 10 |
|---|---|---|---|---|
| Off | 1 | 178 ms | 289 ms | 1,107 ms |
| Off | 2 | 117 ms | 228 ms | 1,051 ms |
| Off | 3 | 117 ms | 229 ms | 1,051 ms |
| On | 1 | 118 ms | 234 ms | 239 ms |
| On | 2 | 118 ms | 173 ms | 180 ms |
| On | 3 | 118 ms | 172 ms | 178 ms |
vLLM has a second cache, for images. It keeps the processed form of each image and reuses it when the same image appears again. The server log reports this as MM cache hit rate, where MM stands for multimodal. That explains both first runs:
- With prefix caching off, run 1 started right after a server restart, so all 10 screenshots were new to the server. Every step included processing a new image.
- With prefix caching on, step 1 of run 1 was already fast. Before that run, I ran
one_request.pyagainst the same server as a first check, and it used screenshot 1. Screenshots 2 to 10 were new.
In runs 2 and 3, all 10 screenshots were already processed, so the repeats were faster. I wanted the server to process 1 new screenshot at each step, so the repeats weren’t the runs I meant to measure.
The fix was to change 1 pixel in every screenshot, differently for each run. Within a run, repeated screenshots still match, as they would for a real agent, and each step includes processing 1 new image. With this fix, step 1 takes about 170 ms in every run, close to the 178 ms in the first run after the restart. All other results in this post come from runs with this fix, including those in Prefix caching across 10 steps .
Several agents at once
The last prediction was about GPU memory: at step 10, 8 agents need 8 × 10,350 = 82,800 tokens of history. Only 78,444 tokens fit, so I expected the server to fail. I ran 4, 6 and 8 agents at once with prefix caching on, each with its own run ID and copy of the screenshots:
| Agents | Wall time | Generated tokens per second | TTFT at step 10 | Decode at step 10 |
|---|---|---|---|---|
| 1 | 9.5 s | 68 | 229 ms | 11.7 ms per token |
| 4 | 15.4 s | 166 | 546 ms | 16.4 ms per token |
| 6 | 26.3 s | 146 | 4,446 ms | 67.1 ms per token |
| 8 | 57.2 s | 90 | 4,260 ms | 103.8 ms per token |
The server didn’t fail. Instead of an out-of-memory error, vLLM kept 1 of the 8 requests waiting until there was room for it:
Running: 7 reqs, Waiting: 1 reqs, GPU KV cache usage: 89.8%,
  Prefix cache hit rate: 54.3%
The cost showed up as time. With 4 agents, the run took 1.6 times as long as with 1, but the GPU produced about 2.5 times as many tokens per second because one read of the weights serves every request in a decode step. With 8 agents, the run took 57.2 s, 6 times as long as with 1. Throughput fell from 166 to 90 tokens per second.
The slowdown also started earlier than predicted. The 8-agent run slowed down at step 7 and the 6-agent run at step 10. That’s about 58,000 and 62,000 tokens of combined history (agents × prompt length at that step), or 74% and 79% of the 78,444-token capacity. These estimates come from the prompt sizes. The server’s own GPU KV cache usage reached 89.8% in the log line above. In the 8-agent run, the prefix cache hit rate fell at the same time, from 71.5% to 54.3%, suggesting that vLLM had thrown away cached history to make room.
To check that, I looked at vLLM’s counters. Its metrics endpoint reports how many prompt tokens it looked up in the prefix cache, how many it found, and how many times it preempted a request. I read the counters before and after the 6-agent run:
curl -s localhost:8000/metrics \
| grep -E "^vllm:(num_preemptions|prefix_cache_queries|prefix_cache_hits)"| Counter | Before | After | Difference |
|---|---|---|---|
prefix_cache_queries_total, prompt tokens looked up | 861,195 | 1,204,605 | 343,410 |
prefix_cache_hits_total, prompt tokens found | 445,248 | 665,280 | 220,032 |
num_preemptions_total | 3 | 3 | 0 |
The lookups match the workload. One agent’s 10 prompts add up to 57,067 tokens, the sum of the “Prompt tokens” column in Prefix caching across 10 steps . For 6 agents, that’s 342,402 tokens. The warm-up request, 1 blank screenshot of about 1,000 tokens, makes up the rest.
The hits don’t match. Without eviction, each agent would find the same cached tokens as in a single-agent run: 44,352 over 10 steps (the sum of the “Cached tokens” column). That would give 266,112 for 6 agents. The counter recorded 220,032, so vLLM reused 46,080 fewer prompt tokens than expected, the equivalent of 80 blocks of 576. That gap measures missed reuse, not how many blocks were evicted. Prefix caching reuses a prompt only up to its first missing block, so losing an early block also prevents reuse of the blocks after it.
Preemption, where vLLM pushes a running request out of memory, didn’t happen at all in this run. The counter stayed at 3, all from earlier runs. So the missed reuse points to cache eviction between steps. When an agent loses part of its cache, vLLM has to process that history again. That takes more GPU time and makes the queue longer for everyone else.
Reflections
On my RTX 5070 Ti, 2 things shaped the results. For a single agent, generating the answers took about 7.3 s with caching on or off, so the speedup came entirely from getting to the first token sooner. With several agents, room for history set the limit: 2.78 GiB of KV cache holds 78,444 tokens. On paper, that’s enough for about 7 agents at step 10, when each prompt is 10,350 tokens long.
I still don’t know why the slowdown started at 74% to 79% of the reported capacity. My guess is that the linear-attention layers, which share the same GPU memory pool as the KV cache, need more of it than the 78,444-token figure allows for, but I haven’t checked. The other gap is in the workload. My replay sends fixed actions instead of the model’s own answers, so the 64 generated tokens never come back into the next prompt.
Note to myself: when the repeat runs look cleaner than the first one, check what the first one paid for that the repeats didn’t.