A Mind Map of Core Machine Learning Concepts
A mind map that breaks down the core ideas of machine learning, including types of learning, core techniques, and commonly used tools.
Table of Contents
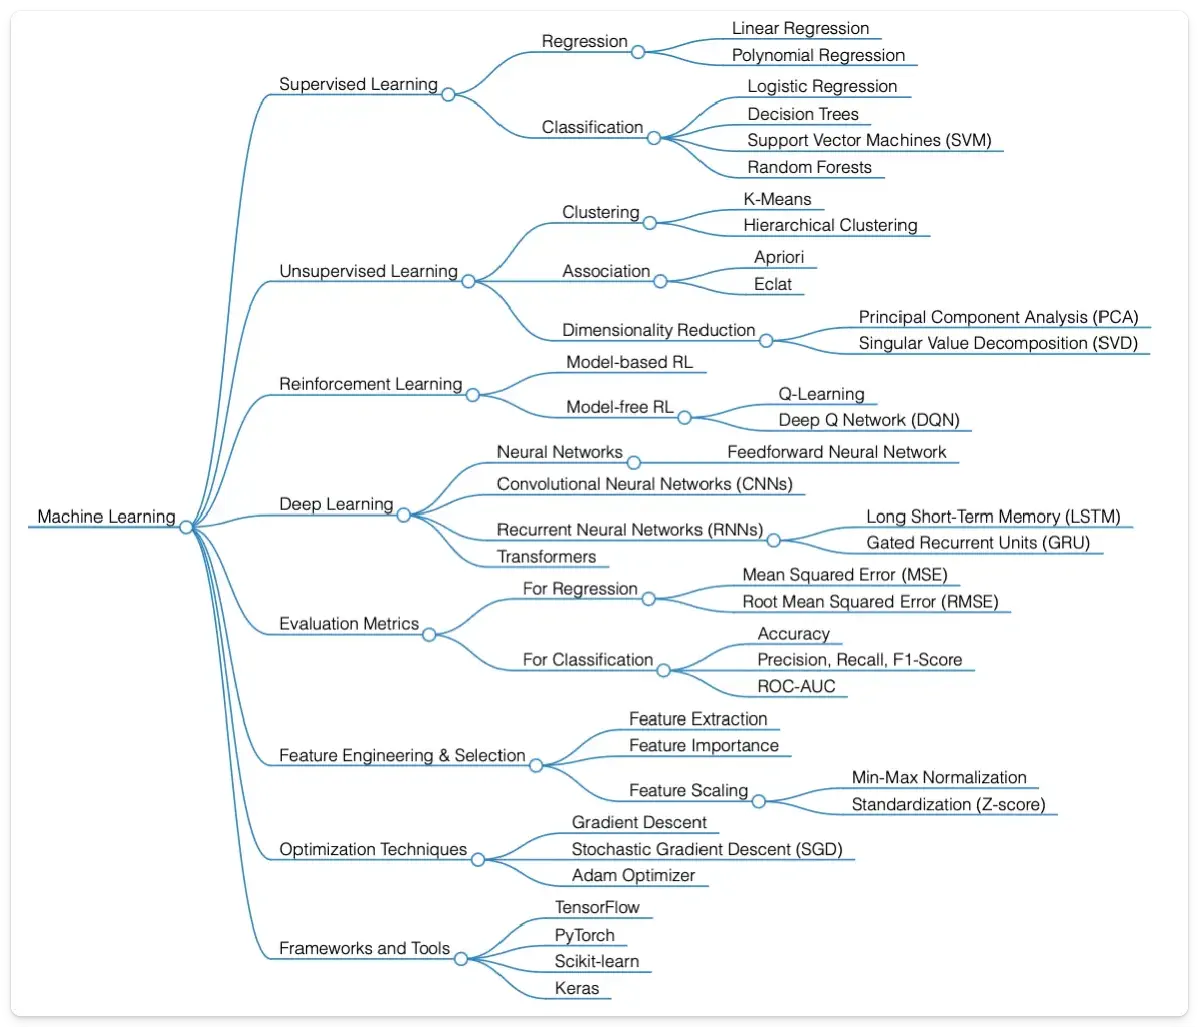
Machine Learning (ML) is one of the biggest drivers of change in tech today. It powers everything from better customer experiences to automating boring, repetitive work.
Here’s a mind map that shows the main building blocks of ML. Below it, I walk through the core ideas and techniques in simple terms to make this broad field a bit less confusing.
If you are new to ML, think of this as a roadmap, a quick way to see the landscape before diving deeper.
Supervised Learning: Teaching Computers to Predict
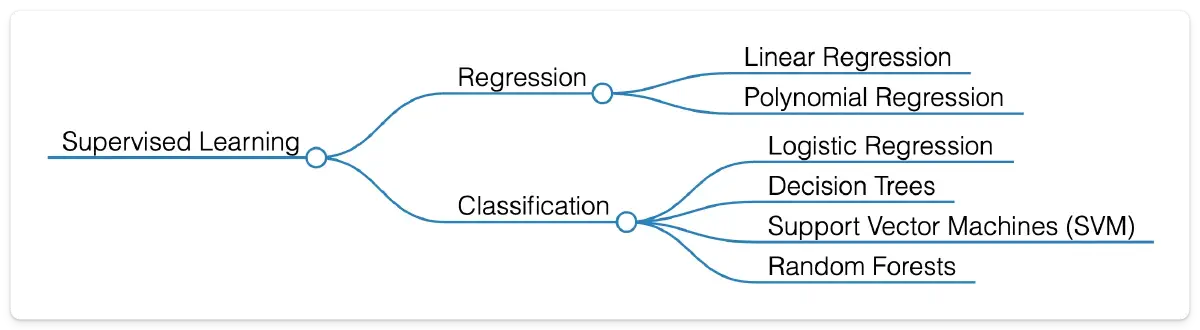
Supervised learning is one of the core ideas in ML. The model learns from labeled data, where the answer is already known, and then uses that knowledge to make predictions on new data.
The two main approaches are Regression and Classification.
Regression: Predicting Continuous Values
Linear Regression and Polynomial Regression are used to predict continuous values.
For example, real estate companies apply Linear Regression to forecast house prices based on size, location, and amenities. Agricultural researchers use Polynomial Regression to estimate crop yields under different environmental conditions. These relationships are often nonlinear, which is why Polynomial Regression can be more effective.
In short, regression is about predicting numbers.
Classification: Sorting Data Into Categories
Classification assigns data points to categories. Common methods include Logistic Regression, Decision Trees, Support Vector Machines (SVM), and Random Forests.
Logistic Regression helps in medical diagnostics by classifying test results as positive or negative. Decision Trees are used in customer service to route inquiries to the right department. SVMs power handwriting recognition, distinguishing letters and numbers. Random Forests are widely used in banking to evaluate loan risk and improve predictive accuracy.
In short, classification is about predicting categories.
Unsupervised Learning: Discovering Hidden Patterns
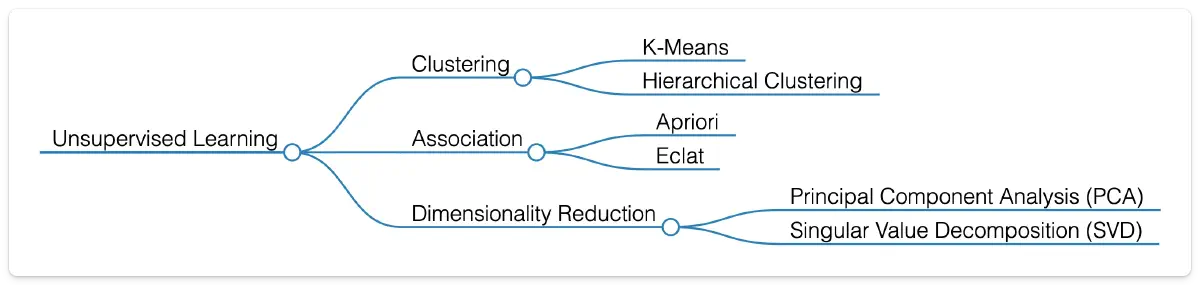
Unsupervised Learning helps models find structure in unlabeled data. The main techniques are Clustering, Association, and Dimensionality Reduction.
Clustering: Grouping Similar Items
Clustering groups together items that share similarities. Two widely used approaches are K-Means and Hierarchical Clustering.
Marketing teams often use K-Means to segment customers by purchasing behavior, which allows them to create targeted campaigns for different groups. K-Means also has practical applications in image compression, as I explored in this post on K-Means image compression .
Hierarchical Clustering is frequently used in genomics to group genes with similar expression patterns, which can reveal functional relationships.
In short, clustering is about finding natural groupings in data.
Association: Finding Variable Relationships
Association techniques uncover hidden relationships between variables. Two common algorithms are Apriori and Eclat.
The Apriori algorithm might reveal that bread and milk are often purchased together. A grocery store can use this insight to design product placements or bundle promotions to boost sales.
Eclat works in a similar way. An online retailer might discover that customers who buy smartphones also tend to purchase cases and screen protectors. This insight can improve recommendation systems, encouraging cross-selling.
In short, association learning finds the “items that go together” in data.
Dimensionality Reduction: Simplifying Complex Data
Dimensionality Reduction reduces the number of features in a dataset while preserving its core structure. Two popular methods are Principal Component Analysis (PCA) and Singular Value Decomposition (SVD).
Finance teams use PCA to simplify complex stock market data, highlighting the most influential patterns and making it easier to analyze trends.
SVD plays a key role in natural language processing. It processes large term-document matrices to uncover latent semantic structures, which helps search engines better understand user intent and return more relevant results, even when exact keywords don’t appear.
In short, dimensionality reduction helps make complex data easier to work with and visualize.
Reinforcement Learning: Learning Through Interaction
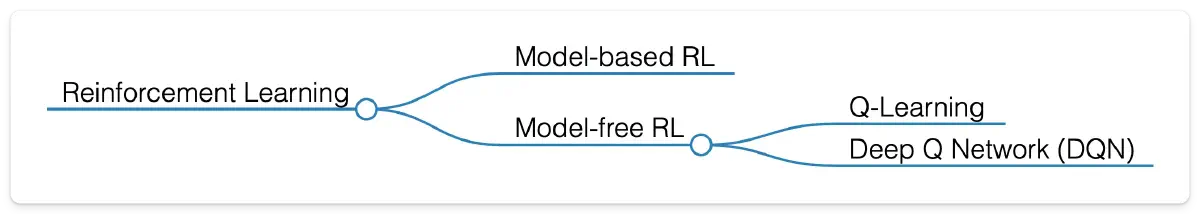
Reinforcement Learning (RL) is about learning by doing. A model interacts with an environment, takes actions, and receives rewards or penalties as feedback. Over time, it learns strategies that maximize rewards.
Model-based RL is often used in robotics, where robots need to plan movements and adapt to their surroundings.
Model-free RL methods, such as Q-Learning and Deep Q Networks (DQN), focus on learning directly from experience. These techniques have powered breakthroughs in game AI, enabling systems to master complex games like chess and Go without human guidance.
In short, RL is trial-and-error learning guided by rewards.
Deep Learning: Learning from Complex Data
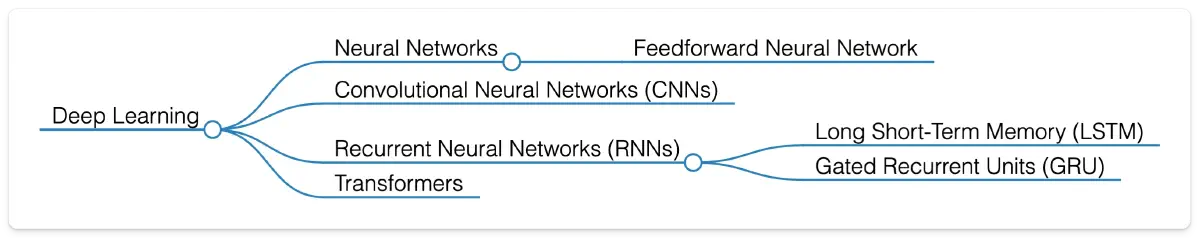
Deep Learning is a subset of Machine Learning that uses neural networks to process large and complex datasets. Different architectures specialize in different types of problems:
- Convolutional Neural Networks (CNNs) excel at image recognition and processing.
- Recurrent Neural Networks (RNNs), including Long Short-Term Memory (LSTM) and Gated Recurrent Units (GRU), are designed for sequential data like text or speech.
- Transformers have revolutionized natural language processing and now power many state-of-the-art AI systems.
These models are everywhere in practice. Neural networks enable voice recognition in virtual assistants. CNNs improve disease diagnosis from medical scans. RNNs drive predictive text, helping your phone suggest the next word as you type. And Transformers set new standards in machine translation, making real-time multilingual communication more accessible than ever.
In short, Deep Learning leverages specialized neural network architectures to tackle vision, language, and sequence problems at scale.
Core Components of Machine Learning
No Machine Learning model works in isolation. To be effective, every model relies on core components that shape how it is built, evaluated, and improved. Three of the most important are Evaluation Metrics, Feature Engineering & Selection, and Optimization Techniques.
Evaluation Metrics: Measuring Model Performance
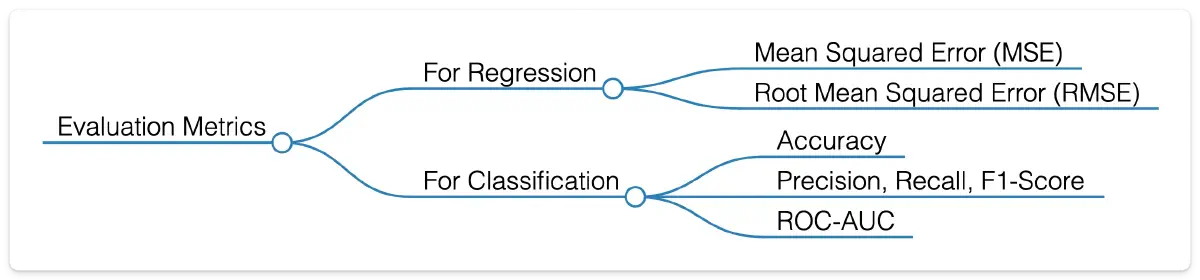
Evaluation metrics give a concrete way to measure how well a model performs.
For regression tasks, metrics such as Mean Squared Error (MSE) and Root Mean Squared Error (RMSE) capture the difference between predicted and actual values. For example, a real estate company might use RMSE to fine-tune its pricing models and improve accuracy.
For classification tasks, common metrics include Accuracy, Precision, Recall, F1-Score, and ROC-AUC (Receiver Operating Characteristic and Area Under the Curve). In spam detection, for instance, accuracy ensures most spam is flagged correctly, while precision and recall help balance catching spam without mislabeling legitimate emails.
In short, Metrics turn abstract model performance into measurable outcomes, guiding improvements and helping avoid blind spots.
Feature Engineering: Shaping the Right Inputs
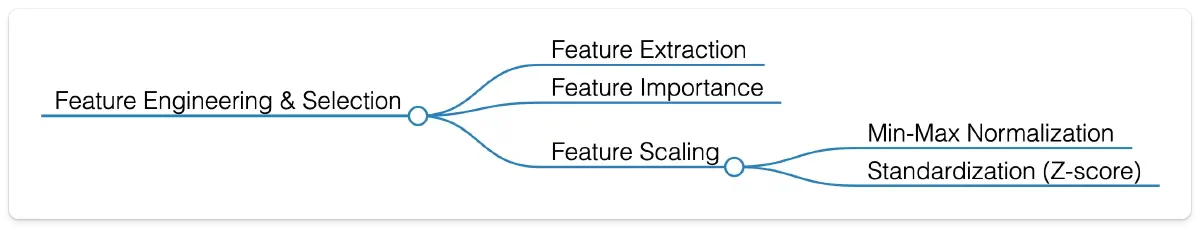
Feature engineering is the process of choosing and transforming data attributes so that a model can learn effectively.
Feature Extraction is often used in text analysis, for example identifying words or phrases that signal sentiment. Feature Importance highlights the variables that matter most, such as the factors driving stock market trends.
Feature Scaling techniques like Min-Max Normalization and Standardization (Z-score) ensure that inputs are on a consistent scale. This is especially important for neural networks, where large differences in input ranges can slow or distort learning.
In short, feature engineering and selection shape the inputs that ultimately determine how well a model performs.
Optimization Techniques: Training Smarter Models

Optimization techniques adjust a model’s parameters to improve performance, usually by minimizing or maximizing a cost function.
The most widely used method is Gradient Descent, which iteratively reduces prediction errors by updating parameters in the direction of steepest improvement.
Variants such as Stochastic Gradient Descent (SGD) and Adam Optimizer improve efficiency on large or complex datasets. They are widely applied in domains like consumer behavior prediction or logistics optimization, where models need to learn quickly from vast amounts of data.
In short, optimization techniques are what make training practical, allowing models to learn effectively from real-world data.
ML Tools and Frameworks
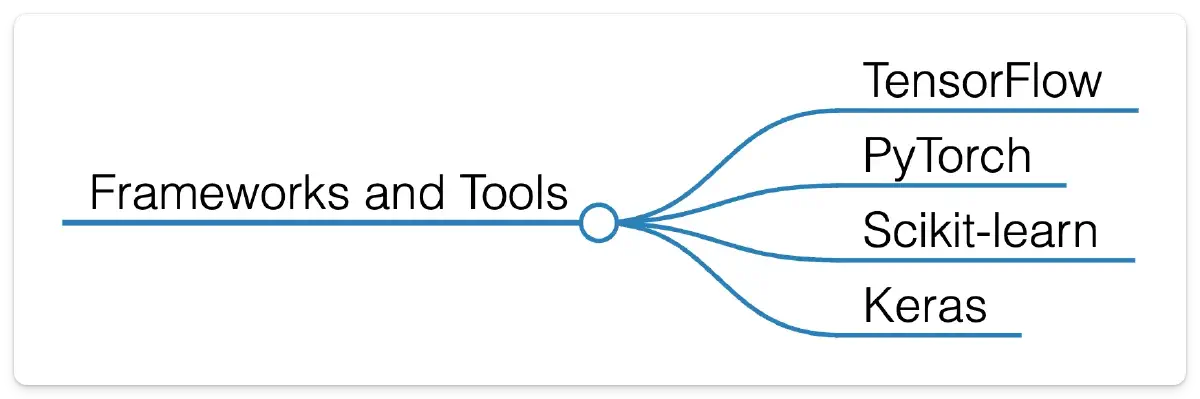
Frameworks and libraries are what make Machine Learning practical. Tools such as TensorFlow, PyTorch, Scikit-learn, and Keras provide ready-made building blocks for model development, training, and deployment. They lower the barrier to entry and allow both researchers and engineers to focus on experimentation and application rather than reinventing the basics.
In short, these tools are the backbone of modern ML work, making advanced analytics accessible to a much wider audience.
Summary
Machine Learning is powerful because it learns from data. That ability makes it one of the cornerstones of modern AI and a driver of real-world change, from smarter healthcare to better search engines.
If you know the foundations, you can go a long way.
You can download the full mind map in PDF format from the Machine Learning Mind Map page.